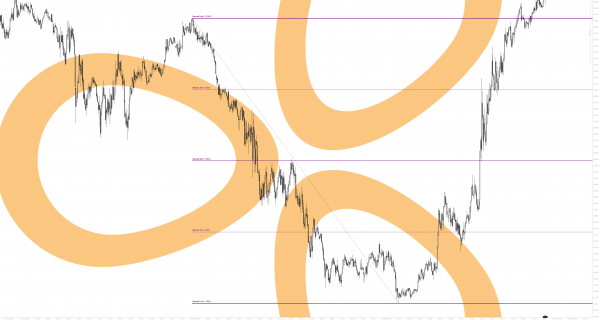
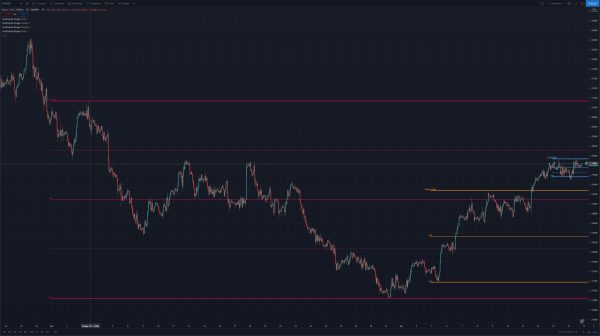
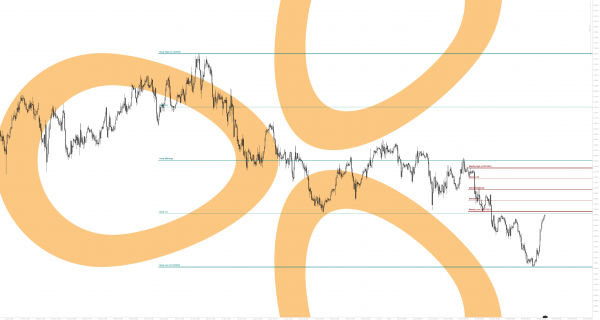
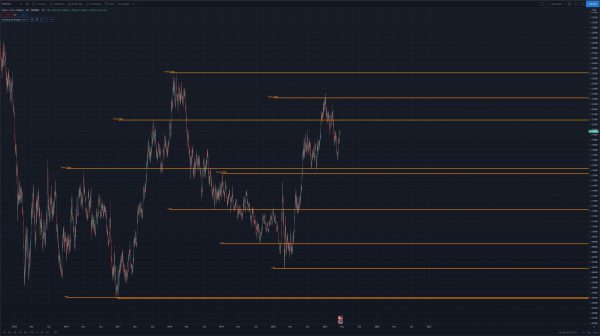
Download
You will be provided a download link in your staticliquid account, and order email immediately after purchase. You are permitted to download this indicator a maximum of three times, within five days.
By downloading this software you agree to the terms and conditions of staticliquid.
Installation
cTrader – Download the zip file containing the indicator and extract the ‘.algo’ file. As long as you have cTrader already installed and running, simply double click the ‘.algo’ file, and cTrader will prompt you to install it automatically.
TradingView – Follow the link to the script in TradingView. Once the page has opened, select the button to “Add to favorite indicators”.
Setup
cTrader
Right click your chart, goto indicators –> custom –> staticliquid Ranges
Configure Options to suit your needs:-
Manual Range:
- On Display? Set to yes if you want the manual range displayed. [Default = Yes]
- Colour R 0-255. Using RGB values, set to the R value for the colour you require. [Default = 125]
- Colour G 0-255. Using RGB values, set to the G value for the colour you require. [Default = 0]
- Colour B 0-255. Using RGB values, set to the B value for the colour you require. [Default = 125]
Monday Range
- On Display? Set to yes if you want the Monday range displayed. [Default = No]
- Prior Mondays 1-2. Set to the number of previous Monday ranges to display. [Default = 2]
- + Midrange. Set to yes to display the midrange level or not. [Default = Yes]
- + Quarterly. Set to yes to display the quarterly range levels or not. [Default = Yes]
- Colour R 0-255. Using RGB values, set to the R value for the colour you require. [Default = 125]
- Colour G 0-255. Using RGB values, set to the G value for the colour you require. [Default = 0]
- Colour B 0-255. Using RGB values, set to the B value for the colour you require. [Default = 0]
Daily Range
- On Display? Set to yes if you want the daily range displayed. [Default = No]
- Prior Dailys 1-5. Set to the number of previous daily ranges to display. [Default = 1]
- + Midrange. Set to yes to display the midrange level or not. [Default = Yes]
- + Quarterly. Set to yes to display the quarterly range levels or not. [Default = Yes]
- Colour R 0-255. Using RGB values, set to the R value for the colour you require. [Default = 125]
- Colour G 0-255. Using RGB values, set to the G value for the colour you require. [Default = 125]
- Colour B 0-255. Using RGB values, set to the B value for the colour you require. [Default = 125]
Weekly Range
- On Display? Set to yes if you want the Weekly range displayed. [Default = No]
- Prior Weeklys 1-5. Set to the number of previous Weekly ranges to display. [Default = 2]
- + Midrange. Set to yes to display the midrange level or not. [Default = Yes]
- + Quarterly. Set to yes to display the quarterly range levels or not. [Default = Yes]
- Colour R 0-255. Using RGB values, set to the R value for the colour you require. [Default = 0]
- Colour G 0-255. Using RGB values, set to the G value for the colour you require. [Default = 125]
- Colour B 0-255. Using RGB values, set to the B value for the colour you require. [Default = 0]
Monthly Range
- On Display? Set to yes if you want the Monthly range displayed. [Default = No]
- Prior Monthlys 1-2. Set to the number of previous Monthly ranges to display. [Default = 2]
- + Midrange. Set to yes to display the midrange level or not. [Default = Yes]
- + Quarterly. Set to yes to display the quarterly range levels or not. [Default = Yes]
- Colour R 0-255. Using RGB values, set to the R value for the colour you require. [Default = 0]
- Colour G 0-255. Using RGB values, set to the G value for the colour you require. [Default = 0]
- Colour B 0-255. Using RGB values, set to the B value for the colour you require. [Default = 125]
Quarterly Range
- On Display? Set to yes if you want the Quarterly range displayed. [Default = No]
- Prior Quarterlys 1-4. Set to the number of previous Quarterly ranges to display. [Default = 2]
- + Midrange. Set to yes to display the midrange level or not. [Default = Yes]
- + Quarterly. Set to yes to display the quarterly range levels or not. [Default = Yes]
- Colour R 0-255. Using RGB values, set to the R value for the colour you require. [Default = 125]
- Colour G 0-255. Using RGB values, set to the G value for the colour you require. [Default = 125]
- Colour B 0-255. Using RGB values, set to the B value for the colour you require. [Default = 0]
Yearly Range
- On Display? Set to yes if you want the Yearly range displayed. [Default = No]
- Prior Yearlys 1-2. Set to the number of previous Yearly ranges to display. [Default = 2]
- + Midrange. Set to yes to display the midrange level or not. [Default = Yes]
- + Quarterly. Set to yes to display the quarterly range levels or not. [Default = Yes]
- Colour R 0-255. Using RGB values, set to the R value for the colour you require. [Default = 0]
- Colour G 0-255. Using RGB values, set to the G value for the colour you require. [Default = 125]
- Colour B 0-255. Using RGB values, set to the B value for the colour you require. [Default = 125]
TradingView
Once the script is favorited, from the chart you wish to plot on, select indicators from the menu. Select “Favorites” and then select ‘staticliuid Ranges’ to add to your chart.
Once added, change the config as you require:
- Range. Set to the range you want displayed. [Default = Daily]
- Color. Set to the color you want this range to be drawn in. [Default = Orange]
- Mid range. Tick to display the mid range line. [Default = True]
- Quarterly range. Tick to display the mid range line. [Default = True]
- Prior Ranges (1-5). The previous targeted range, or number of prior ranges you wish to display. [Default = 1]
- Targeted Prior Range?. Tick to only show the targeted range. [Default = True]

![logo-[orange]-2000×2000 Slide](http://staticliquid.com/wp-content/plugins/revslider/public/assets/assets/dummy.png)
