context
I see the word context banded about quite a bit at the moment. so i thought i’d try and give some …. errr …. context around it.
when i think of context i think about the ‘bigger picture’. as technical traders we all have our price patterns we look for to get us in (or indeed out) of the market. but without building a bigger picture of what’s happening, you will more often than not get steam rolled.
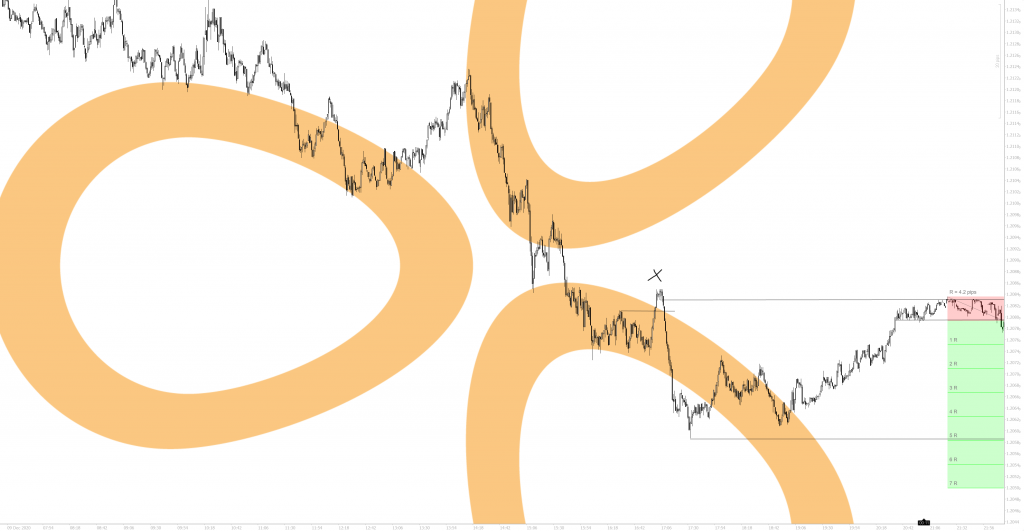
as an example, here looks a juicy setup on eurusd five minute timeframe. its already dropped quite a bit, so this is just a continuation and an obvious place to get in short on the retest that’s just about to happen. trending down so its bound to make new lows and give us 5R.

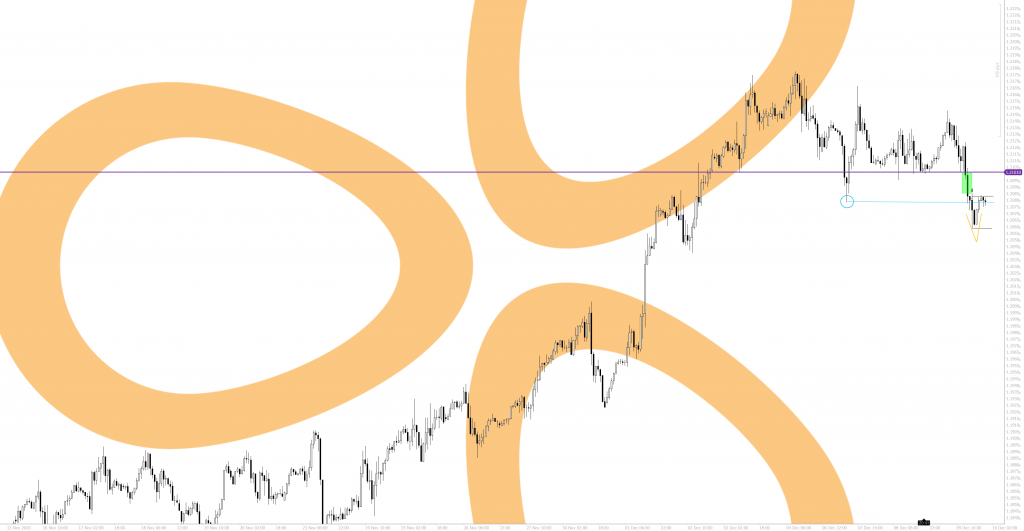
however, lets have a look at the context within the hourly timeframe. first lets look at our invalidation point of the trade idea. “x” marks the spot and look at the high it swing failed giving us our invalidation in the 5 min chart above. on the hourly chart below that high means nothing, and is mid candle. the importance of that high and therefore the invalidation point is diminished. next look at the green box on the hourly chart. that fast move down is inefficient. this means there is probable cause for this to be ‘filled in’ later. giving more credence to a long, not a short. next look at the blue circle and line on the hourly chart. i do expect a bounce short from this (as appearing currently as I type this), but i believe it will be short lived as the major level I personally see is the higher purple line, and this was a deviation. liquidity pools around the more obvious levels, as people place orders for entries and exits around them. this is thus drawing in price like a magnet. lastly on the hourly chart, the price action at the bottom marked in orange, is a ‘V’ shape. this is an aggressive way for price to bounce, and can also indicate higher prices, and can offer an invalidation for longs. one more thing to look at is the time, and it is currently 23:35 GMT. we are in the asian session now, and so with lower liquidity this could just be a grind following the days larger move, before it gets moving in the main sessions again tomorrow.
all in all, in the hourly timeframe there’s more to say price will go up towards the purple line, than below the V shape bottom at present. the 5 min trade idea based on price pattern alone, isn’t relating to the context of what’s happening on the hourly timeframe. yes you may get a bounce lower, but not to new lows where the target is.

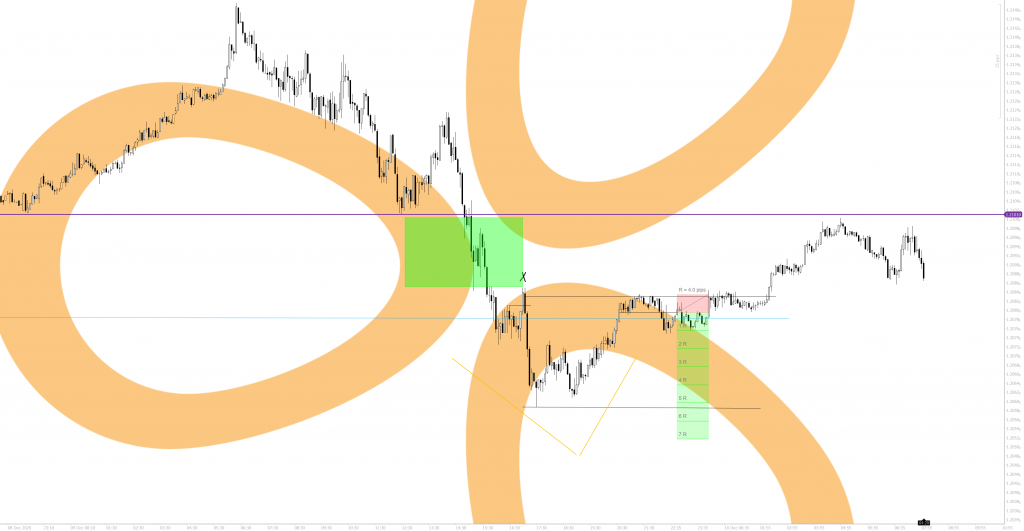
so what happened….?
well you could have took 1R off the small bounce i mentioned may happen. but if you’d have held for target, you’d have got wiped out. look at the PA from the more defined level now though. that’s a much better place to look for shorts.

of course this is just looking up a few time frames higher. context doesn’t stop there. you need to perform multi-timeframe analysis, to build up a bigger picture. daily, weekly, monthly all have a story to tell and fundamentals then come into play also at those timeframes. hopefully now you can see why your twitter feed is full of people saying:
context > price pattern

![logo-[orange]-2000×2000 Slide](http://staticliquid.com/wp-content/plugins/revslider/sr6/assets/assets/dummy.png)
