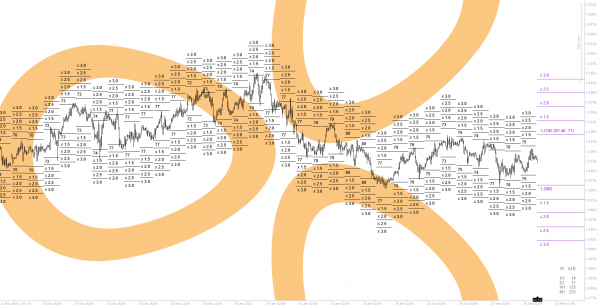
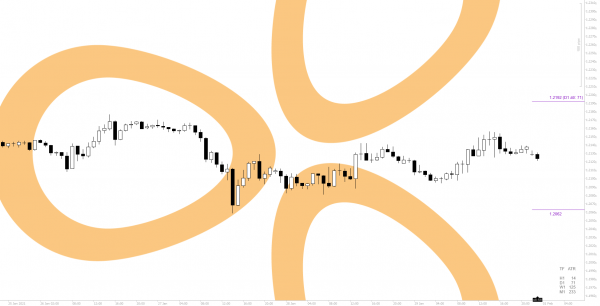
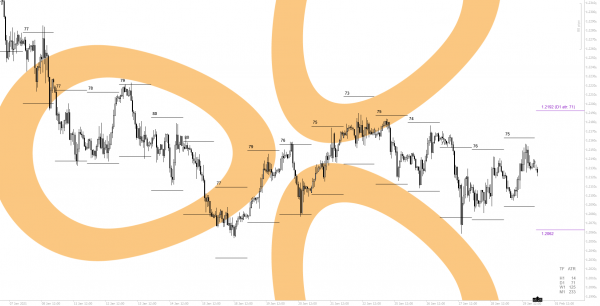
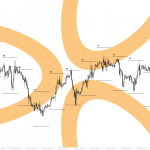
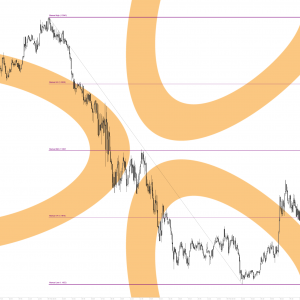
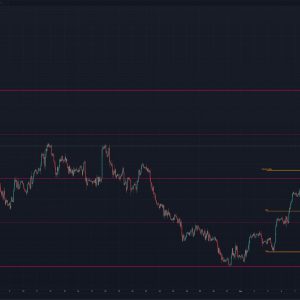
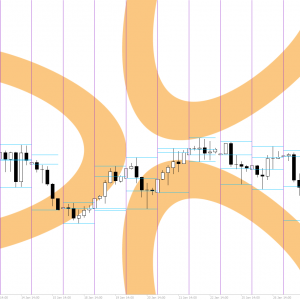
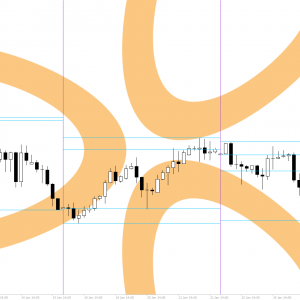
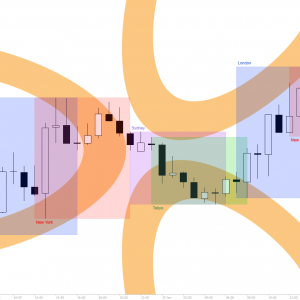
This was inspired by Trader Dante’s D1atr indicator. His is for MT4, and this is for cTrader, with additional features. This is now version 4.0 which has had significant additional features; please review version history for more info.
Platform
This indicator comes included with versions for cTrader only.
Usage
ATR is the average true range for the time frame your looking at over the periods you specified. This gives an indication of current volatility, and how much the market may move during that time period. The table lists a few time-frames and their average true ranges, and can be toggled off to hide it if you so wish..
If price is moving up, the upper line on the chart shows where the top of the daily ATR would be. Vice versa, moving down, the lower line shows where the low of the daily ATR would be. Simply put, if price moves past these lines, it means you are above the average true range for the day, and so a mean reversion is becoming more and more likely the further you extend past it.
If price does move past a line, the line will change colour (depending on your settings).
Historical Values can be toggled on for the use of back-testing a strategy.
atr multiples can be helpful for the occasions where prices moves far beyond (1x) atr.
TIP: If you wish to display multiple atr’s (D1 AND H1 for example, or more) on same chart you can! Simply add the indicator and configure for your first timeframe (D1 for example), then add the indicator again and configure for your next atr. Add it for all the different ones you wish to display at the same time! Remember to use different colours for the different ATR levels to easily differentiate them!

![logo-[orange]-2000×2000 Slide](http://staticliquid.com/wp-content/plugins/revslider/sr6/assets/assets/dummy.png)
